Reports
Overview
The EIS Gateway contains a series of standardized reports from the EIS database. The reports can be filtered to specific sets of data you are interested in. All reports have a standard set of columns to display and filtering options available, but many of the reports have optional features that also may be selected. Be sure to investigate the various drop-down items to see what is available for the given report. This section of the EIS User’s Manual describes the steps involved in requesting and downloading a snapshot report. This will also describe the different types of filtering options you may encounter when creating an EIS report.
Request Reports
Requests run every 10 minutes. CSV format; CERS XML format
To get started, refer to the following steps:
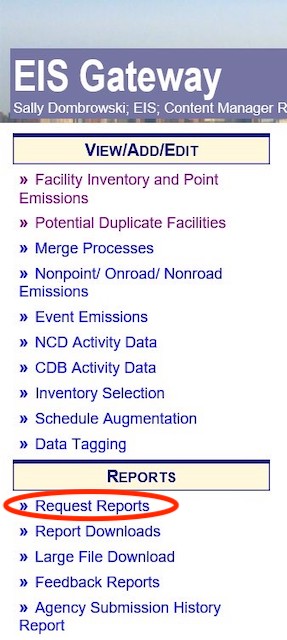
- From within the EIS Gateway, you will see on the left side of the page a heading entitled “Request Reports”.
- After you have selected the Request Report option, choose the report you are interested in. Click here to see a complete list of the reports available and obtain detailed information about the data represented in these reports.
- There are several filters from which to choose. Available filters vary by which report has been selected. Click here for a list of all the filters and data options you may see when requesting a report (Listed alphabetically).
Once your filters have been set, click the Request Report button to create the report. This puts your report request into a queue. The reports are then executed one after the other until all report requests have been completed. When complete, your reports can be downloaded using the Download Reports function from the left-side menu.
Report Downloads
To download your requested reports, you will need to go to Report Download on the sidebar menu under Reports.
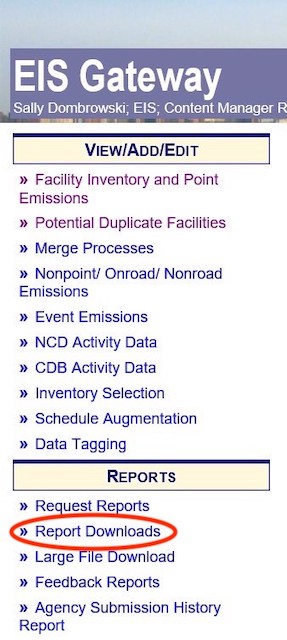
You will receive an email notifying you when your report is ready to be downloaded.
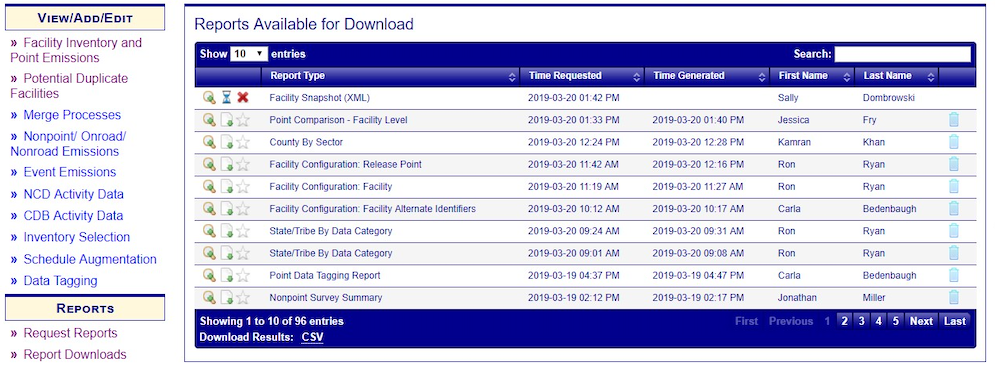
Find your report in the list of Reports Available for Download. There are four different icons that could be associated with your report:
The following accordions will provide information related to the facility site. Each of these accordions may have the following features
-
 Magnifying Glass – If selected, this will display the
report criteria submitted
with
the report request.
Magnifying Glass – If selected, this will display the
report criteria submitted
with
the report request.
-
 Hour Glass – Indicates that the system is working to
create the report.
Hour Glass – Indicates that the system is working to
create the report.
-
 Red “X” – If selected, cancels the report request.
-
 Sheet of Paper – Indicates that the report is complete
and ready for download.
Sheet of Paper – Indicates that the report is complete
and ready for download.
Your report is complete when the Sheet of Paper icon is available and when you receive an email. Here is an example of what the email notification may look like:
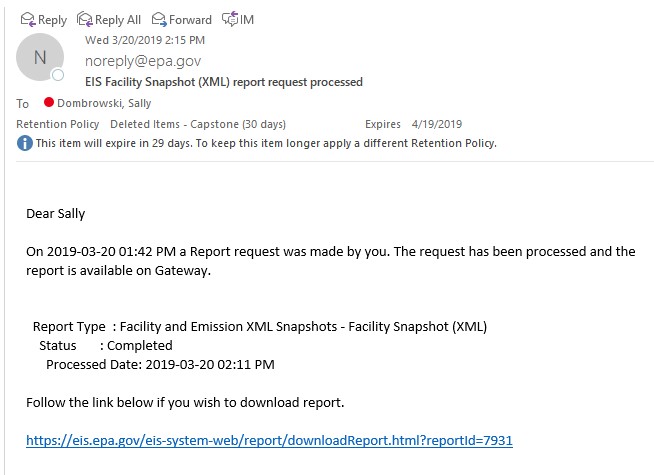
To download the report, click on the Sheet of Paper icon.
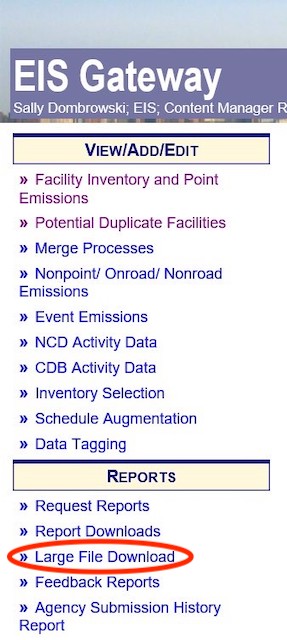
Large File Downloads
Since the report generation function is a shared resource by all EIS users, a set of report output may be generated by Inventory Developers to be accessible by all users. These are generally large, national extractions of data based on National Emissions Inventory (NEI) selections. The information contained in these reports are static. That is, the data within them is only accurate as of the date originally generated.
To get started, refer to the following steps:
- From within the EIS Gateway, you will see on the left side of the page a heading entitled Large File Download.
- Review the descriptions in the Report Type and Report Description columns to determine if this is the information you want to download. Remember these files are going to be large!
- There are two different icons that will be associated with each report:
-
 Magnifying Glass – If selected, this will display the report criteria
submitted
with
the report request.
Magnifying Glass – If selected, this will display the report criteria
submitted
with
the report request.
 Sheet of Paper– Indicates that the report is
complete and
ready for download.
Sheet of Paper– Indicates that the report is
complete and
ready for download.
-
To download the report, click on the Sheet of Paper icon.
Feedback Reports
The Feedback Report is accessible from the left navigation menu menu item from the EIS Gateway provides the functionality for you to filter a list of Nonpoint, Onroad, or Onroad locations and their details. This section describes the process for viewing a full list of emissions source locations associated with your agency or for viewing the detailed information for a single location.
Agency Submission History Reports
The Agency Submission History reports are online status reports that provide information on all of the EIS data submissions completed by state, local, and tribal agencies plus any agency they have been granted access to. The reports also display a count of the Expected and Total number of facilities submitted by an agency as well as all of those facilities reporting emissions.
Data Completeness Reports
The Data Completeness Reports or Quality Assurance Status and Assessment Reports are a series of reports available for viewing on the EIS Gateway that display data indicating submission of data by agencies for a given inventory cycle. These reports provide a mechanism to determine progress on how well or how complete an agency is doing with reporting their current year submissions. Only Active Submissions will be displayed in the reports, however it is possible in some cases where more than one reporting year may be active and available for viewing on the Gateway. Data Completeness Reports are currently available for Point, Nonpoint, Nonroad and Onroad data categories. Different types of metrics used may vary depending on the data category.