Nonpoint Emissions Data Completeness Reports
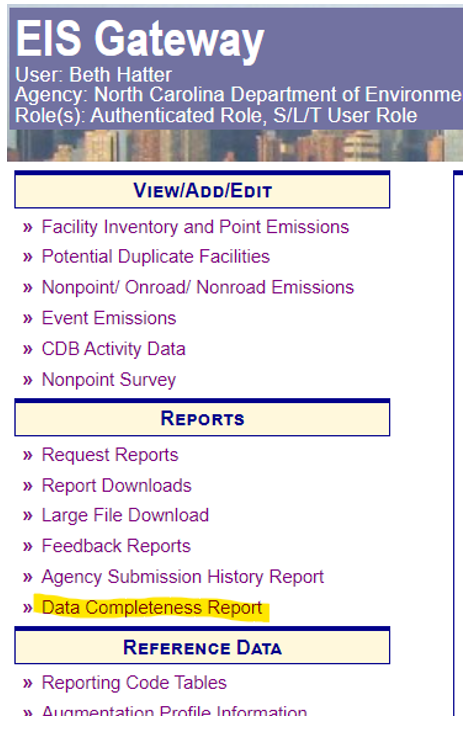
The Nonpoint Data Completeness Report provides an EIS User with data indicating the submission of nonpoint emissions data for a given inventory cycle. A user can access the reports by clicking on the Data Completeness Report under the Reports heading of the Gateway navigation menu.
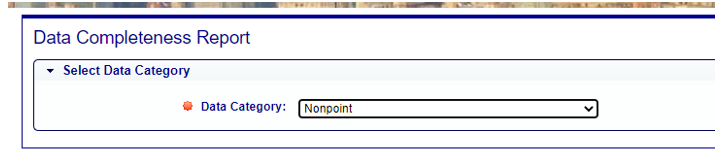
When on the Data Completeness Report page, select the Nonpoint data category from the drop down menu which will automatically navigate you to the Nonpoint Emissions Data Completeness Summary Report
Nonpoint Emissions Data Completeness Summary Report
The Nonpoint Emissions Data Completeness Summary report will display information for your agency for both Nonpoint Survey Completeness as well as Nonpoint emissions submitted to EIS.
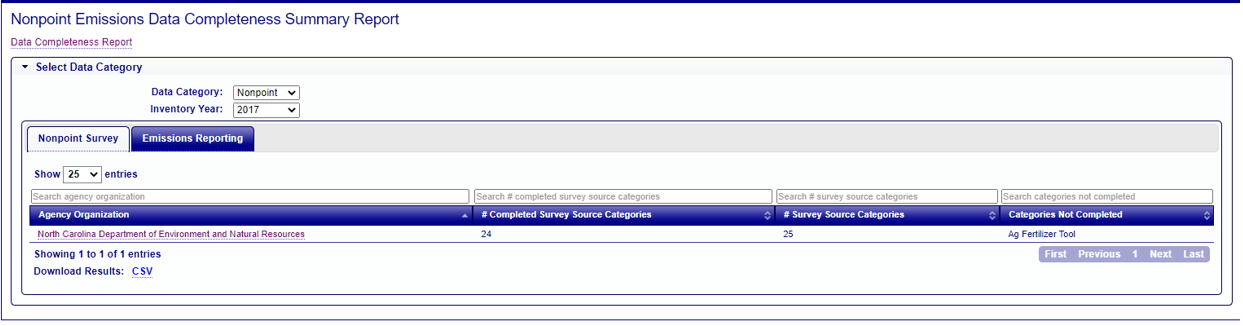
When opening the page, the summary report defaults to the Nonpoint Survey Completeness report. Clicking on the tabs above the data table allows the user to navigate between the Survey completeness information or emissions reported by clicking the Nonpoint Survey and Emissions Reporting tabs respectively.
Nonpoint Emissions Data Completeness Summary Report – Nonpoint Survey
The Nonpoint Survey Completeness Summary Report displays the following information for each agency:
- Agency Organization name
- Number of Completed Source Categories
- Total Number of Survey Source Categories
- List of Source Categories not Completed
You may sort and filter the table using the double arrow icon and search box above each column. You can also download the data table and any filtered or sorted results in a CSV file by clicking the CSV link below the table.
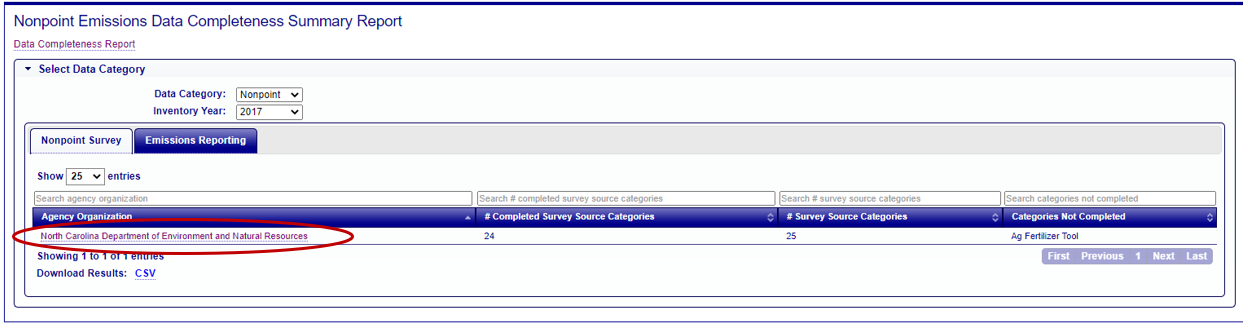
Clicking on the Agency Organization name in the report will open the Nonpoint Survey Detail Report.
Nonpoint Survey Detail Report
Agency information for the selected report is displayed above the report table including the description of the Agency that requested the report, the year of the Nonpoint Survey, and the completion status of the Survey for that agency and inventory year.
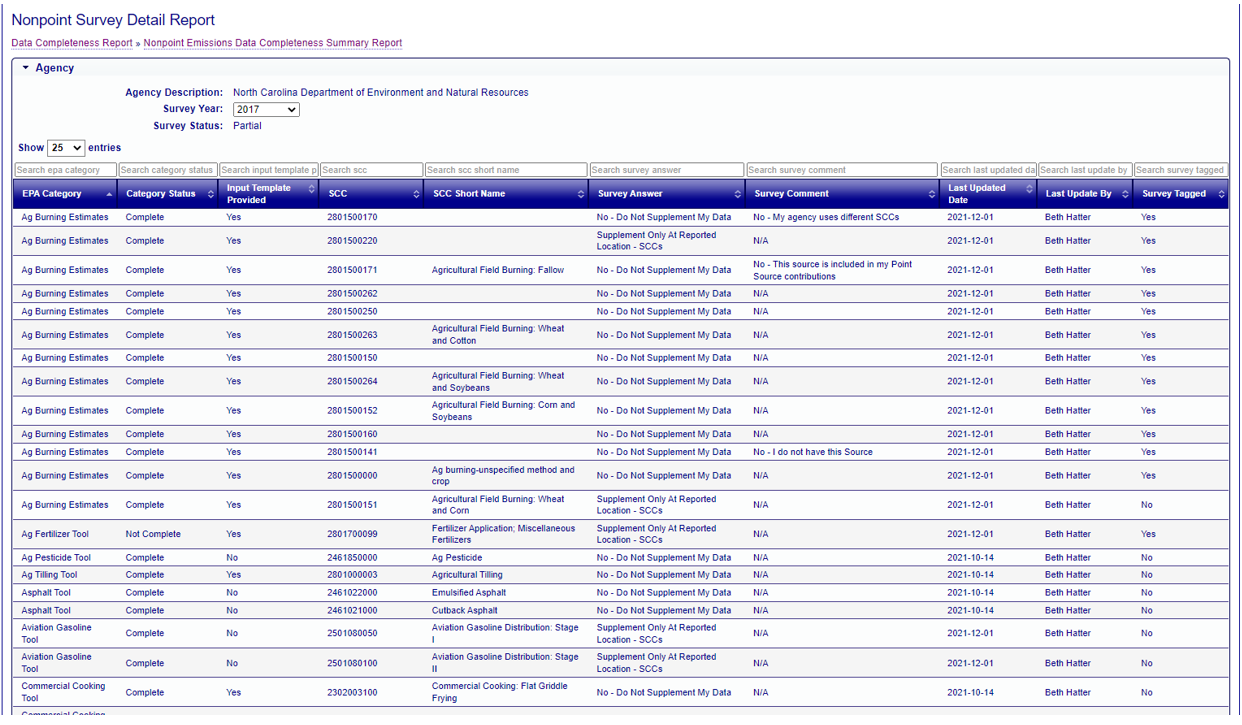
The Nonpoint Survey Detail Report table displays the following information for the selected agency:
- EPA Category
- Category Status (Complete or Not Complete)
- Input Template Provided (Yes/No)
- SCC
- SCC Short Name
- Survey Answer
- Survey Comment
- Last Update Date of Survey
- Survey Tagged (Yes/No)
You may sort and filter the table using the double arrow icon and search box above each column. You can also download the data table and any filtered or sorted results in a CSV file by clicking the CSV link below the table.
Nonpoint Emissions Data Completeness Summary Report -Emissions Reporting
For each unique sector in the Nonpoint Survey, the Emissions Reporting Summary will track how the data submission has been met by reporting how the Non-Point Survey has been answered; whether an input template was used, and/or whether emissions have been reported to a sector.
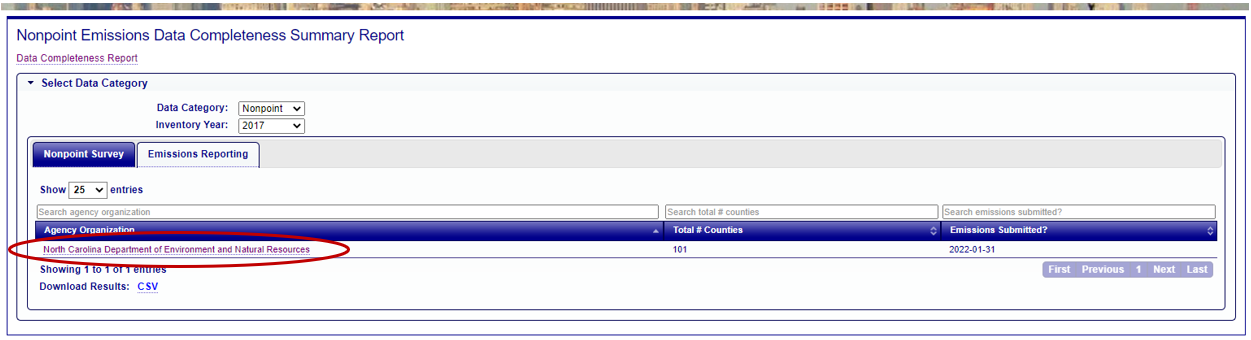
The summary report for Emissions Reporting will display the number of counties under the jurisdiction of an agency (for tribal organizations, this will be “1”) as well as the date and time that the agency submitted a “PRODUCTION” submission for nonpoint emissions. If no nonpoint emissions data have been submitted to EIS, the Emissions Submitted? column will display “NA.”
Clicking on the Agency Organization name in the report will display the Nonpoint Survey Detail Report.
Nonpoint Emissions Reporting Detail Report
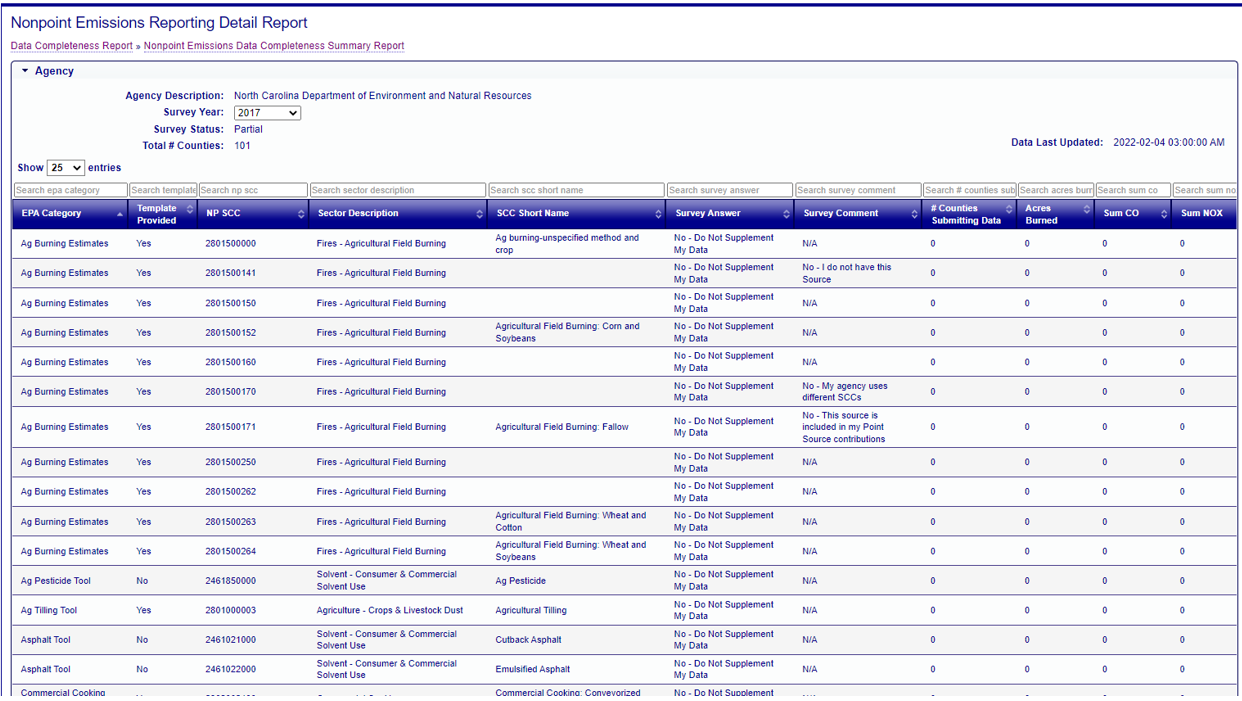
Data displayed in the Emissions Reporting Detail report will include any Nonpoint Survey Source Classification Code where the answer in the survey is “No, Do Not Supplement My Data.”
The following fields are included in the Detail report:
- EPA Category (Survey Category)
- Template Provided? – Yes/No
- Nonpoint Source Classification Code (SCC)
- Sector Description
- SCC Short Name
- Survey Answer
- Survey Comment
- # Counties Submitting Data – Number of distinct counties within the agency that submitted emissions data for the SCC
- Acres burned (for Agricultural Burning)
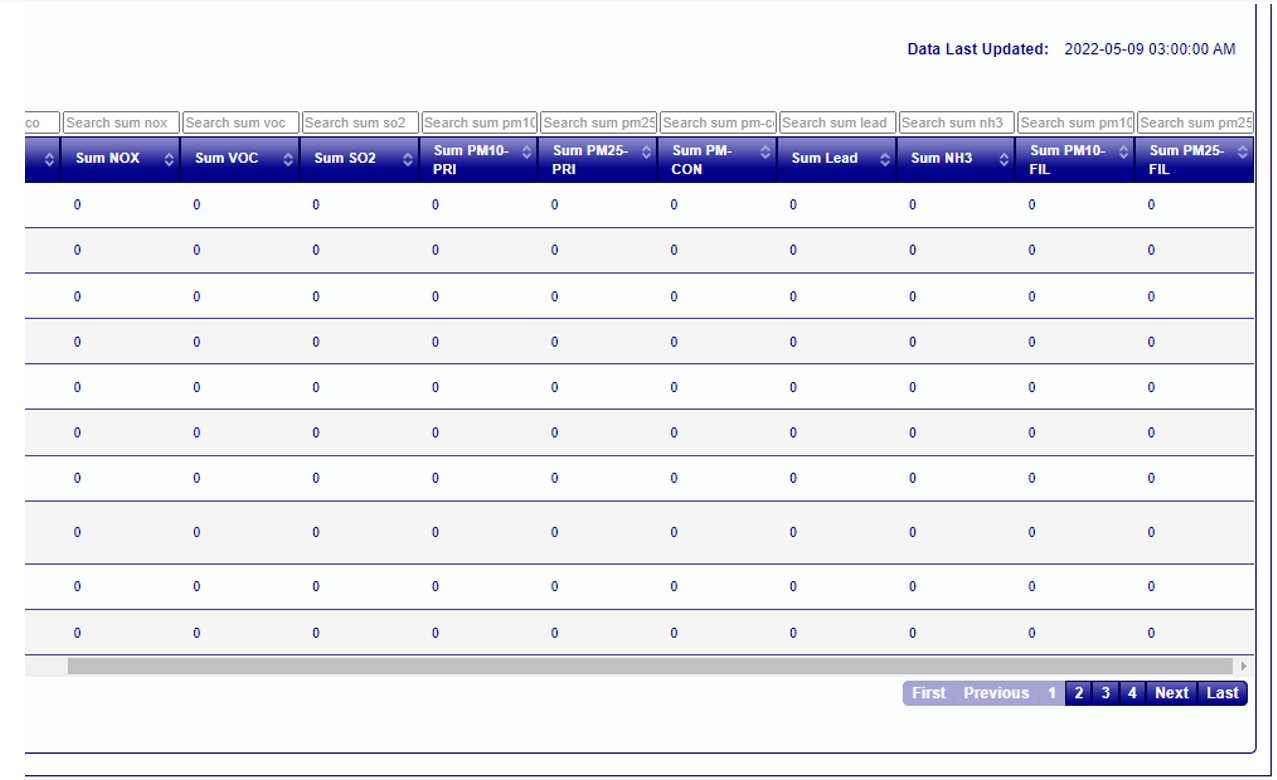
- Sum CO - Total annual sum (in Tons) of CO emissions submitted by the agency for the given SCC
- Sum NOx - Total annual sum (in Tons) of NOX emissions submitted by the agency for the given SCC
- Sum VOC - Total annual sum (in Tons) of VOC emissions submitted by the agency for the given SCC
- Sum SO2 - Total annual sum (in Tons) of SO2 emissions submitted by the agency for the given SCC
- Sum PM10 -PRI - Total annual sum (in Tons) of PM10-PRI emissions submitted by the agency for the given SCC
- Sum PM2.5 -PRI - Total annual sum (in Tons) of PM2.5-PRI emissions submitted by the agency for the given SCC
- Sum PM CON - Total annual sum (in Tons) of PM-CON emissions submitted by the agency for the given SCC
- Sum Lead - Total annual sum (in Tons) of Lead emissions submitted by the agency for the given SCC
- Sum NH3 - Total annual sum (in Tons) of NH3 emissions submitted by the agency for the given SCC
- Sum PM10 -FIL - Total annual sum (in Tons) of PM10-FIL emissions submitted by the agency for the given SCC
- Sum PM2.5 -FIL - Total annual sum (in Tons) of PM10-FIL emissions submitted by the agency for the given SCC
You may sort and filter the table using the double arrow icon and search box above each column. You can also download the data table and any filtered or sorted results in a CSV file by clicking the CSV link below the table.
- Nonpoint Emissions Data Completeness Reports
- Nonpoint Emissions Data Completeness Summary Report
- Nonpoint Emissions Data Completeness Summary Report – Nonpoint Survey
- Nonpoint Survey Detail Report
- Nonpoint Emissions Data Completeness Summary Report - Emissions Reporting
- Nonpoint Emissions Reporting Detail Report